Sample Size Determination in Cross-Sectional Studies

Introduction

Determining the sample size is a crucial step in designing a cross-sectional study, as it directly affects the statistical reliability and validity of research findings. The process to determine sample size follows different methods depending on whether a study is descriptive or analytical cross-sectional.

Descriptive studies aim to estimate prevalence, whereas analytical studies compare prevalence between different subject groups.

This paper explores how to determine sample size in cross-sectional studies while also highlighting the key statistical concepts and formulas for both descriptive and analytical studies.

Key Factors in Cross-Sectional Study Sample Size

In a cross-sectional study design, determining appropriate sample size is crucial to generate statistically representative and reliable data. This depends on factors like:

  • type of study (descriptive vs. analytical)
  • the frequency of the outcome
  • the desired margin of error, and
  • statistical power

For example, a descriptive study on customer satisfaction requires a large sample size to estimate overall satisfaction, while an analytical study on pricing strategies and sales requires a sufficient sample size to detect meaningful relationships between price and demand.

Calculating Sample Size in Cross-Sectional Study Designs

Calculating sample size for descriptive cross-sectional studies is different from analytical cross-sectional studies, as each type has distinct goals and requirements [1].  

1. Descriptive Cross-Sectional Studies

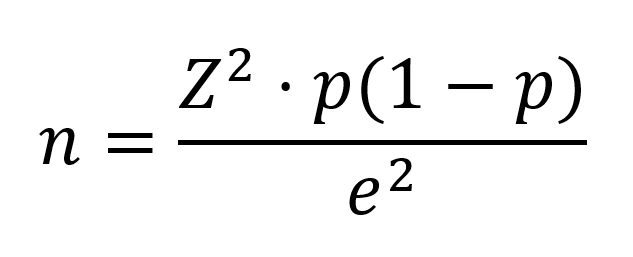
These studies focus on the determination of the prevalence of a condition or characteristic in a population. The sample size for such studies is calculated using

  • estimated prevalence rate (p) of the condition
  • desired margin of error (e), and
  • significance level (α).

The formula used is:

Descriptive Cross-Sectional Studies

(Latex code: n=\frac{Z^2 \cdot p(1-p)}{e^2})

Where:

  • n = required sample size
  • Z = critical value of the normal distribution (1.96 for 95% confidence level)
  • p = estimated prevalence rate
  • e = desired margin of error

This calculation helps to verify that the sample selected contains sufficient participants to generate valid statistical prevalence results. For example, a market research study on customer satisfaction with a satisfaction estimate of 80%, a margin of error of 4%, and a 95% confidence level, the required sample size would be 385 to ensure sufficiency and reliable representation of the population.

2. Analytical Cross-Sectional Studies

These studies compare prevalence rates across two or more groups or variables [2]. The sample size for such studies depends on:

  • prevalence rates of each group (p₁, p₂),
  • the expected difference between groups,
  • significance level (α), and
  • statistical power (β)

The formula based on Fleiss et al. (1981) for calculating the sample size in studies comparing two proportions is:

Analytical Cross-Sectional Studies

(Latex code: n= \frac{{(Z_{\alpha/2} + Z_{\beta})^2 \cdot [p_1(1-p_1) + p_2(1-p_2)]}}{(p_1 – p_2)^2})

Where:

  • n = sample size for each group
  • = critical value for significance level
  • = critical value for statistical power
  • p₁, p₂ = prevalence rates of the groups

This formula guarantees that the study will have enough statistical power to identify differences in prevalence rates between groups.

Online Sample Size Calculation Tools and Services

Using an such as Raosoft, OpenEpi, and ClinCalc allow researchers to quickly determine the sample size by inputting margin of error, confidence levels, and statistical power value.

These user-friendly tools help the researcher to streamline the process, reducing potential for errors

Online Sample Size Calculation Tools and Services

Source: Raosoft, n.d.

Methodological Considerations in Sample Size Determination

When determining sample size, researchers must consider several key factors to ensure the study is both statistically valid and feasible, such as:

  • Estimated Prevalence Rate: Existing literature reviews or pilot studies provide reliable estimates for the study [3].
  • Balancing Sample Size and Feasibility: Larger samples improve reliability but require more financial resources and additional logistical challenges, while smaller samples lack statistical power [4].
  • Adjusting for Non-Response Rate: A 10-20% increase in sample size is often recommended to account for non-participation.

Sample Size Calculation for a Business Study

1. Descriptive Study Example

Research Question: What is the customer satisfaction rate with a new product in each market?

Assumptions:

  • Estimated satisfaction rate (p) = 70% (0.70)
  • Margin of error (e) = 5% (0.05)
  • Z-score = 1.96 (95% confidence interval)

Then,

Analytical Study Example

(Latex code: n=\frac{{(1.96)^2 \times (0.70) \times (0.30)}}{(0.05)^2} = 323)

Therefore, the required sample size necessary to estimate customer satisfaction with 95% confidence and a 5% margin of error is 323.

2. Analytical Study Example

Research Question: Does offering discounts increase sales in a retail store compared to not offering discounts?

Assumptions:

  • Prevalence of increased sales with discounts (p₁) = 40%
  • Prevalence of increased sales without discounts (p₂) = 25%
  • Significance level = 0.05
  • Statistical power = 80%

Therefore, the required sample size is 149 participants per group. Then, the total sample size for this analytical study involving two groups (discounts vs. no discounts) is approximately 298 participants.

Conclusion

Determining the appropriate sample size is essential for ensuring validity and reliability in any cross-sectional as it forms the core of study’s sample planning process.

Sample size formulas in descriptive studies differ from the sample size formulas used in analytical studies. Therefore, researcher must carefully consider factors such as the prevalence, confidence intervals, power, and feasibility during the planning phase.

Researchers can also take advantage of statistical applications and services and statistical tools available online to avoid an inefficient selection of sample size, ultimately enhancing rigor and credibility of the study findings. This approach helps the researcher to ensure that the study is both scientifically robust and practically feasible.

Research Excellence Defined with Tutors India

Conducting proper, high-quality research requires a great set of skills. Even a minor statistical error in sample size or methodology may result in an invalid study. Seeking an expert help increases the probability of erroneous statistical significance, invalid conclusions, wasted time, and wasted research work.

Tutors India provides expert-driven solutions to provide assurance for methodological accuracy, ethical rigor, and academic integrity. Our expertise includes both researchers and statisticians who will improve your study from conception to end.

Achieve excellence in research. Connect with Tutors India today.

References

  1. Upadhaya, H. P. (2019). Sample Size Estimation in Medical Research. Seed Foundatıon Health Journal3(1), 25-30. https://www.researchgate.net/profile/Hari-Upadhyay-3/publication/364947146_Sample-Size-Estimation-in-Medical-Research-Hari-Prasad-Upadhaya-page-25-30/links/635fea3412cbac6a3e11607f/Sample-Size-Estimation-in-Medical-Research-Hari-Prasad-Upadhaya-page-25-30.pdf
  2. Kesmodel, U. S. (2018). Cross‐sectional studies–what are they good for?. Acta obstetricia et gynecologica Scandinavica, 97(4), 388-393. https://obgyn.onlinelibrary.wiley.com/doi/abs/10.1111/aogs.13331
  3. Naing, L., Nordin, R. B., Abdul Rahman, H., & Naing, Y. T. (2022). Sample size calculation for prevalence studies using Scalex and ScalaR calculators. BMC Medical Research Methodology, 22(1), 209.https://bmcmedresmethodol.biomedcentral.com/articles/10.1186/s12874-022-01694-7
  4. Althubaiti, A. (2023). Sample size determination: A practical guide for health researchers. Journal of general and family medicine, 24(2), 72-78.https://pmc.ncbi.nlm.nih.gov/articles/PMC10000262/